Original research · Affiliate catalogues
Two retailers topped 89 of 97 affiliate catalogue searches
A study of 9,700 live listings: when a creator searches a product catalogue, the search is choosing the retailer for them.
Some links here are affiliate links — if you buy, the retailer may pay us a commission at no extra cost to you. We have earned $0 from them so far. Here’s how it works.
Part of: Research
Two retailers were the largest supplier in 89 of 97 keyword samples. On 3 September 2026 we ran 20 product keywords against a live affiliate product catalogue at five read depths each — 97 completed samples, 9,700 live US in-stock listings — and counted which advertiser supplied the most rows in every sample.
Poshmark topped 46 samples and Wayfair 43. Five other retailers topped one sample each. In 14 of the 97 samples exactly one advertiser appeared at all, and searching ‘gold necklace’ returned the same single marketplace at every depth we tested, down to the 9,000th row.
The finding
| Retailer | Samples it topped | Share of 97 samples |
|---|---|---|
| Poshmark | 46 | 47.4% |
| Wayfair | 43 | 44.3% |
| BetterWorld.com | 3 | 3.1% |
| Zoro | 2 | 2.1% |
| Replacements Ltd. | 1 | 1.0% |
| Macy's | 1 | 1.0% |
| UnbeatableSale.com | 1 | 1.0% |
| Top two combined | 89 | 91.8% |
97 samples of up to 100 live US in-stock listings each, across 20 keywords and 5 read depths, 3 September 2026.
Two other summary figures are worth having. In half the keywords, one retailer supplied more than 80% of all rows returned; the median top-three share was 93.2%. The most competitive keyword in the study, ‘dog collar’, still had its top three suppliers at 51.6%.
This is not a claim that these two companies dominate affiliate retail. It is a measurement of what a keyword search returns, which is a different and, for anyone using such a search, more immediately consequential thing.
Every keyword, and who supplied it
Sorted by concentration. ‘Top share’ is the proportion of all returned rows supplied by the single largest advertiser; ‘top three’ is the same for the three largest combined.
| Keyword | Rows | Distinct advertisers | Largest supplier | Top share | Top three | Median price |
|---|---|---|---|---|---|---|
| gold necklace | 500 | 1 | Poshmark | 100.0% | 100.0% | $38.00 |
| throw blanket | 500 | 1 | Wayfair | 100.0% | 100.0% | $81.99 |
| sneakers | 500 | 5 | Poshmark | 99.0% | 99.6% | $65.00 |
| wool scarf | 500 | 8 | Poshmark | 97.4% | 98.8% | $71.50 |
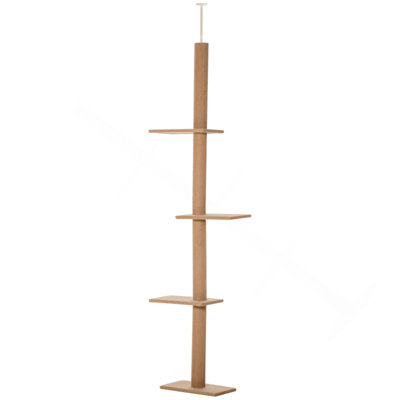
| cat tree | 500 | 10 | Wayfair | 91.0% | 97.0% | $114.48 |
| cashmere | 500 | 11 | Poshmark | 89.8% | 94.0% | $150.00 |
| hiking boots | 500 | 12 | Poshmark | 88.2% | 93.4% | $73.50 |
| backpack | 500 | 18 | Poshmark | 86.4% | 93.0% | $50.00 |
| birkenstock | 500 | 9 | Poshmark | 84.6% | 97.8% | $99.50 |
| dog bed | 500 | 12 | Wayfair | 81.6% | 96.8% | $101.79 |
| camping tent | 500 | 22 | Wayfair | 79.8% | 86.4% | $169.99 |
| vinyl record | 500 | 15 | Wayfair | 74.2% | 92.6% | $61.99 |
| coffee grinder | 500 | 31 | Wayfair | 54.0% | 72.0% | $79.99 |
| cast iron skillet | 500 | 33 | Wayfair | 52.8% | 78.0% | $66.99 |
| sleeping bag | 500 | 31 | Poshmark | 51.8% | 71.8% | $37.99 |
| espresso machine | 500 | 38 | Wayfair | 51.4% | 73.0% | $249.00 |
| hardcover book | 500 | 18 | Poshmark | 47.6% | 95.4% | $11.00 |
| pyrex | 200 | 11 | Replacements Ltd. | 47.0% | 85.0% | $45.00 |
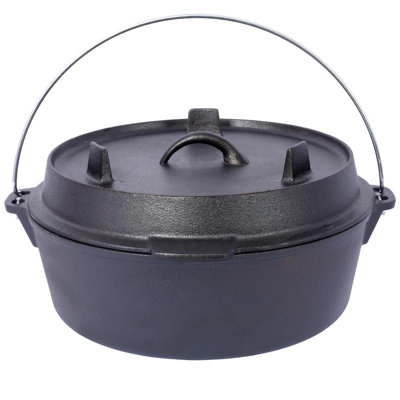
| dutch oven | 500 | 32 | Wayfair | 36.8% | 61.2% | $82.02 |
| dog collar | 500 | 36 | Poshmark | 19.6% | 51.6% | $26.74 |
Live US in-stock listings, pulled 3 September 2026 at offsets 0, 1,000, 3,000, 5,000 and 9,000. ‘Pyrex’ returned 200 rows because deeper offsets were empty — a genuinely smaller catalogue, and reported as such rather than dropped.
Prices checked 3 September 2026 against live US retailer listings pulled during this run.
The spread across that table is the second finding. Distinct advertisers ranged from 1 to 38 for the same size of sample. A creator searching ‘dog collar’ is choosing among 36 retailers; a creator searching ‘gold necklace’ has no choice at all. Nothing on the surface of a search tool tells you which situation you are in.
Whether it is an ordering artefact
The obvious objection is that we only measured the front of the result set, where whatever the catalogue sorts by would dominate. So the study was built to test that: every keyword was read at five depths, from the first row to the 9,000th.
| Keyword | Offset 0 | Offset 1,000 | Offset 3,000 | Offset 5,000 | Offset 9,000 |
|---|---|---|---|---|---|
| gold necklace | 100.0% | 100.0% | 100.0% | 100.0% | 100.0% |
| throw blanket | 100.0% | 100.0% | 100.0% | 100.0% | 100.0% |
| cashmere | 97.0% | 91.0% | 85.0% | 87.0% | 89.0% |
| hiking boots | 95.0% | 100.0% | 86.0% | 87.0% | 73.0% |
| dog bed | 95.0% | 96.0% | 87.0% | 74.0% | 56.0% |
| espresso machine | 65.0% | 60.0% | 47.0% | 43.0% | 42.0% |
| dutch oven | 45.0% | 33.0% | 56.0% | 51.0% | 39.0% |
| sleeping bag | 84.0% | 41.0% | 70.0% | 37.0% | 27.0% |
Share of each 100-row sample supplied by its largest advertiser, by read depth. 3 September 2026.
Concentration softens with depth but does not resolve. Two keywords — ‘gold necklace’ and ‘throw blanket’ — returned a single advertiser in all five samples, 500 rows each, with no second retailer anywhere. Cashmere never fell below 85%. Across the whole study, 14 of the 97 samples contained exactly one advertiser.
The keywords that do dilute, such as espresso machines and sleeping bags, dilute steadily rather than suddenly, which is what you would expect if depth reaches genuinely different inventory rather than shuffling the same. So: reading deeper helps, and it does not fix a single-supplier category.
Keep reading
Why this happens
- Marketplaces list per item, retailers list per product. One resale marketplace can carry tens of thousands of rows for a category where a conventional retailer carries a few hundred product pages. It wins on row count without selling more.
- Some categories are structurally one-sided. Used clothing and jewellery flow through resale; furniture and homeware flow through large home retailers. The concentration follows the goods.
- Catalogue membership is not market share. A retailer absent from this catalogue may be large and may simply run its programme elsewhere.
- Keyword matching is loose. The catalogue OR-matches multi-word queries, so ‘camping tent’ returns books about camping. That inflates whichever advertiser has the most rows containing either word.
- Nobody designed this. It is the arithmetic of row counts meeting a keyword index, and it is invisible from inside a search box.
What it means for a creator
- Your tool is picking your retailer. If you search and link the first good match, the retailer was chosen by row counts, not by you.
- Check the advertiser before you link, not after. A marketplace listing is one item in one size and disappears when it sells; a retailer product page usually does not.
- Search by brand as well as by category. Brand filters return a different and usually broader set of retailers than category keywords do.
- Expect single-supplier categories and plan for them. In jewellery and soft furnishings you may have no second option inside the catalogue at all.
- Read deeper than the first page when you want variety. It reliably surfaces more advertisers, even when it does not break the leader's grip.

What this data cannot show
Stating this plainly matters more than the finding, because a number like 91.8% travels further than the caveats attached to it.
- It is not market share. We measured rows in one catalogue, not sales, revenue or shopper behaviour anywhere.
- It is not the whole affiliate industry. One catalogue, one company ID, one morning. Other networks expose different retailers.
- It says nothing about commission. The API exposes no commission data at all — re-verified by schema introspection during this run — so a concentrated category might pay better or worse and we cannot tell you which.
- It does not measure what shoppers see. A Google search for the same keyword returns an entirely different set of retailers.
- Result ordering is undocumented. We controlled for it by reading five depths rather than one, which is a mitigation, not a solution.
- Availability is the feed's claim. Rows were filtered to in-stock as the feed reports it; we did not verify stock at any retailer.
- Counts are floors. Duplicate listings, discontinued stock and loose keyword matching all sit inside these numbers, as they sit inside anyone's.
Method
- 20 keywords chosen to span categories we already publish on: apparel, footwear, jewellery, homeware, cookware, coffee equipment, outdoor, pet, books and collectables.
- 5 read depths per keyword — offsets 0, 1,000, 3,000, 5,000 and 9,000 — each returning up to 100 rows.
- Filters: US advertisers, USD, in-stock as reported by the feed. No brand or category filter, because category filtering is not available to our access level.
- 97 of the 100 intended samples returned rows. The three that did not were deep offsets on a smaller catalogue (‘pyrex’), which is reported rather than backfilled.
- 9,700 listings in total. For each sample we counted distinct advertisers and the share held by the largest.
- We do not quote the catalogue's own total counts. They are unreliable for multi-word keywords: the API reports 9.7 million matches for ‘espresso machine’, which is a count of rows containing either word. Every figure here is counted from rows we actually received.
- Date: 3 September 2026. Catalogues change daily and this is a snapshot.
Frequently asked
Which retailers dominate affiliate product catalogues?
In this study, two: Poshmark and Wayfair were the largest supplier in 89 of 97 samples covering 9,700 live US listings on 3 September 2026. Poshmark topped 46 samples and Wayfair 43.
Is retailer concentration just an artefact of the first page of results?
No. We read each keyword at five depths, from the first row to the 9,000th. Concentration softened with depth but did not disappear: 'gold necklace' returned the same single advertiser at every depth we tested.
What does this mean for a creator?
If your linking workflow is to search a catalogue and take what comes back, the workflow is choosing your retailer for you, and usually choosing one of two. In half the keywords we tested, one retailer supplied over 80% of results.
How many listings did you check?
9,700 live US in-stock listings, across 20 keywords and 5 read depths, in 97 samples of up to 100 rows each.
Does this measure the whole affiliate industry?
No. It measures what one product catalogue returned to one company ID on one morning. It is not a census of affiliate retail and cannot be.
Method and scope
- 9,700 live US in-stock listings across 97 samples, pulled from the CJ GraphQL product API on 3 September 2026 at five read depths per keyword.
- Counts are of listing rows, not of products or of sales. A row is one listing as the catalogue returned it.
- Advertiser names are as the catalogue reports them.
- Median prices are the listing price at the moment of the pull and are included for context only; this study is about supply, not pricing.
- No commission data appears anywhere in this study because the API exposes none, re-verified by schema introspection during this run, and because we hold no network approvals and have earned nothing.
Last verified 3 September 2026 against 9,700 live US listings across 97 catalogue samples, pulled and counted during this run
Keep reading
How this guide was made. We research and draft these guides with AI, then a person checks every price, link and factual claim against the source before it publishes. We work this way because it lets us re-verify prices across hundreds of guides in a day, which is what keeps the numbers here current; it does not decide what we recommend. Anything we could not verify is labelled as unverified rather than filled in.