Creator Desk
Engagement Rate Calculator
Part of: The business of being a creatorFor creators
There is no single engagement rate. There are four formulas in common use, they disagree with each other by a wide margin on the same account, and a brand will pick whichever one it prefers. This calculates all four from the same numbers so you know what each one says about you before someone else does the arithmetic.
| Formula | What it divides by | Your rate |
|---|---|---|
| By followers (ER) | Followers | — |
| By reach (ERR) | Accounts reached | — |
| Likes only | Followers | — |
| With saves and shares | Reach | — |
Enter your numbers to see the spread.
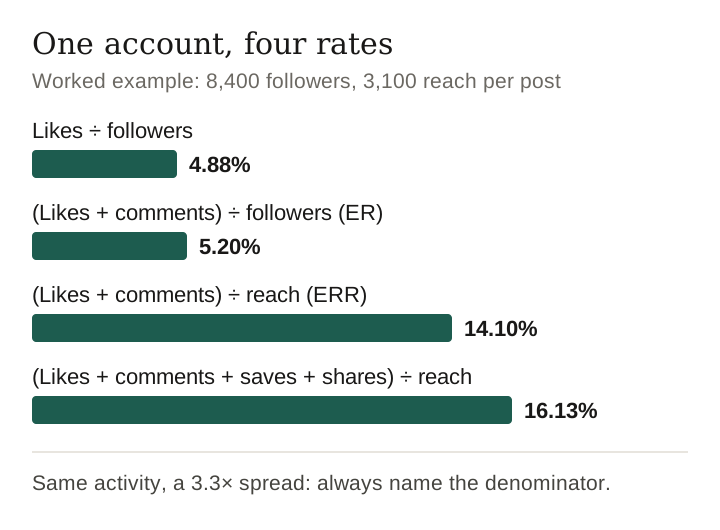
The same account, four different rates
The numbers loaded above are a worked example, not a real account — 8,400 followers, 3,100 reach per post, 410 likes, 27 comments, 63 saves and shares. Here is every formula done longhand on those figures, so you can see exactly where each one comes from and check ours.
Two intermediate numbers do most of the work. Basic interactions
are likes plus comments: 410 + 27 = 437. Full interactions
add saves and shares: 410 + 27 + 63 = 500.
1. Engagement by followers (ER)
(likes + comments) ÷ followers × 100
437 ÷ 8,400 = 0.05202 → 5.20%
The denominator is everyone who follows you, including the ones who never saw the post. This is the conservative number and the one a stranger can approximate from the outside.
2. Engagement by reach (ERR)
(likes + comments) ÷ accounts reached × 100
437 ÷ 3,100 = 0.14097 → 14.10%
The denominator is only the accounts that actually saw it. Nearly three times the first figure, from identical activity, because the denominator shrank by 63%.
3. Likes only, over followers
likes ÷ followers × 100
410 ÷ 8,400 = 0.04881 → 4.88%
Some brand-side templates still count likes alone. It is the least flattering of the four here and the easiest to compute without your help.
4. Full interactions, over reach
(likes + comments + saves + shares) ÷ accounts reached × 100
500 ÷ 3,100 = 0.16129 → 16.13%
The most generous framing available, and the most useful one for product content, because saves and shares are the actions that precede a purchase.
Same account. Same posts. 4.88% to 16.13% — a 3.3× spread. Nobody has lied at any point. Every one of those four numbers is arithmetically correct, and which one appears in a deck is a choice made by whoever is writing the deck.
That is the whole reason this page exists. A rate quoted without its denominator is not a measurement, it is a selection. When you quote one, name the formula in the same breath — and when someone quotes one at you, ask which formula produced it before you accept the comparison.
Keep reading →
Which number a brand will use
Expect engagement by followers. It is the one most brand-side templates ask for, because it is the only one an outsider can verify from a public profile — they can count your followers and your likes without your consent. The reach-based figures are usually kinder to you and completely unverifiable from outside, which is exactly why a sceptical buyer discounts them.
That produces a specific, avoidable mistake: leading a media kit with the reach-based number, and being asked for the follower-based one in the next email. You have then anchored high and been corrected downward, which is a worse position than opening with the honest figure.
Lead with followers, then show reach
Give the follower-based rate first, then the reach-based rate beside it with reach stated. Two numbers with their denominators named reads as someone who understands their own analytics. One flattering number with no denominator reads as someone hoping nobody checks.
Why saves and shares deserve their own line
A like is the cheapest action on any platform. A save is someone intending to come back to the thing you showed them, and a share is someone spending their own credibility on it. For product content those two predict purchase behaviour far better than likes, which is why the fourth formula above exists at all.
If your saves-and-shares figure is strong while your like rate is ordinary, that is worth saying explicitly in a pitch, with the raw counts next to it. It is the difference between an audience that scrolls past approvingly and an audience that acts.
What breaks these formulas
All four assume the numbers going in mean what you think they mean. Several common situations quietly break that assumption, and knowing which one applies to you is the difference between a defensible figure and one that collapses when a brand checks.
Reach is not one thing
- Reach and impressions are different numbers. Reach counts unique accounts; impressions count views, including repeats. Dividing interactions by impressions produces a smaller, wronger number than dividing by reach. Check which one your analytics screen is showing before you copy it.
- Reach varies enormously by format. A short video pushed to non-followers and a static post shown mostly to followers are not comparable, so a reach-based rate mixing both describes nothing in particular.
- Non-follower reach inflates the denominator. If a post travels beyond your audience, ERR falls even though the post did well. The better it travels, the worse this formula makes you look.
The follower denominator decays
- Follower-based rates fall as an account grows. Inactive and dormant accounts accumulate in the denominator and never leave. A declining ER can mean the account is growing, not that the content got worse.
- Bought or botted followers wreck it outright. Purchased followers add denominator and no interactions. This is also why an unusually low rate on a large account invites suspicion rather than sympathy.
The numerator is not always honest
- Reciprocal comment groups inflate comments without any buying intent behind them, and brands that look at comment quality rather than comment count can tell.
- Saves and shares are not universally available. Not every platform and format reports both, so formula four is simply uncomputable in some places. Say so rather than substituting a zero, which would understate you.
The sample is usually too small or wrongly chosen
- One viral post drags a mean anywhere. Use the median across your last nine to twelve posts; it is harder to inflate and better describes what the next post will do.
- Deleting or archiving weak posts silently improves every figure on this page. If you do it, your own numbers stop meaning what you think they mean.
- Stories, lives and DMs are invisible here. An account whose real engagement happens in replies will look weak under all four formulas. That is a limitation of the formulas, not of the account, and it is worth stating explicitly in a pitch rather than hoping nobody notices the low number.
Our own view: if two or more of the above apply to you, publish the follower-based rate anyway and add one line explaining the distortion. A number with a caveat reads as competence. A flattering number that falls apart under a question reads as something worse, and brand-side readers ask that question routinely.
What a rate does not tell anyone
- Whether the audience buys. Engagement measures attention, not intent. A craft account with warm comments can convert worse than a quieter account whose followers came looking for product recommendations.
- Whether the audience matches the brand. A high rate from the wrong country is not useful to a retailer that ships domestically.
- Whether one post carried the average. Median across your recent posts is more honest than the mean; one viral post drags an average somewhere you cannot repeat.
Questions
What is a good engagement rate?
We are not going to give you a number to compare yourself against, because the honest ranges are wide and they differ by platform, niche, follower band and format. Anyone quoting one benchmark across all of that is guessing. What is defensible: smaller accounts routinely post higher rates than large ones, so being compared against a celebrity account's rate is a comparison you should decline.
Should I use mean or median?
Median across your last nine to twelve posts. It is harder to inflate and it describes what a brand can actually expect from the next post.
Do I include followers who never see the post?
That is precisely what the two families of formula disagree about. The follower-based rate includes them; the reach-based rate does not. Show both.
Why do I get different engagement rates on different sites?
Because they are running different formulas on the same activity. On the worked example above the four in common use return 4.88%, 5.20%, 14.10% and 16.13% — a 3.3× spread with no dishonesty anywhere. Always ask which denominator a quoted rate used.
Why is my engagement rate falling as I grow?
Usually arithmetic rather than performance. Inactive followers accumulate in the denominator of the follower-based formulas and never leave, so the rate drifts down even when reach and interactions hold steady. The reach-based figures are less affected.
Should I use reach or impressions?
Reach. It counts unique accounts; impressions count views including repeats, so dividing by impressions produces a smaller number that answers a different question. Whichever you use, name it next to the figure.
Last verified 1 September 2026, and expanded the same day with the worked arithmetic for all four formulas and the section on what breaks them. This page describes formulas and how they are read, not platform features; the arithmetic is stable, but where a platform reports reach does change, so the reach-versus-impressions note is the part most likely to need revisiting. Nothing here is an earnings estimate, and no benchmark rate is published anywhere on this page.
Keep going →
How this page was made. Drafted with AI (Claude); not yet independently re-checked. How we work