LinkToLooks · Guides · Creator Desk
Creator Desk
Writing a product line that still makes sense when the price changes
We pulled the same listings twice, 52 minutes apart. 1.0% had changed price and 21.8% had vanished — and the second number is the one to write for.
Part of: For creators
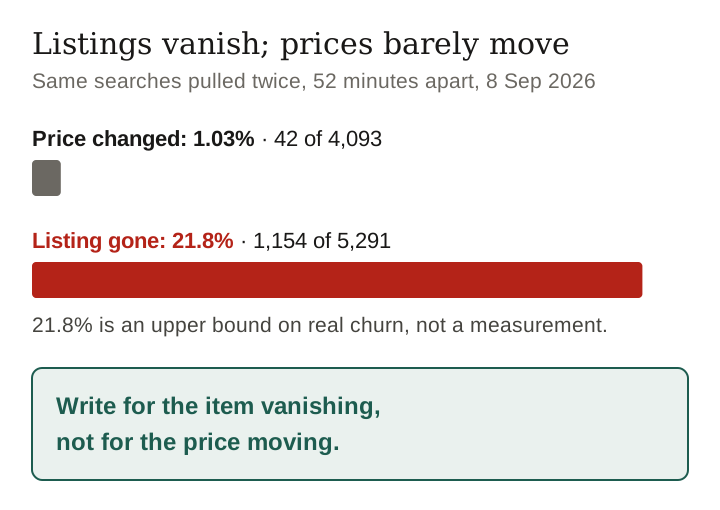
The measurement first. We ran the same 18 product searches twice on 8 September 2026, 52 minutes apart, and matched the listings that appeared in both. Of 4,093 listings priced in both pulls, 42 had changed asking price — 1.03%, 23 up and 19 down, median move 5.3%. In the same 52 minutes, 1,154 of 5,291 listings — 21.8% — were not in the second pull at all. Prices are not the fragile part of a product line. The listing is.
What we did, and why twice
Advice about writing product recommendations usually says “prices change” and stops there. We wanted the rate, because the rate decides how much of your writing has to be defensive.
So: one pull at the start of the run, an identical pull 52 minutes later, same 18 keyword seeds, same account, same depth, nothing changed but the clock. Listings were matched across the two pulls on retailer plus title plus destination URL, so a difference between them is a difference in the listing rather than a difference in which listings we happened to get.
Last verified 8 September 2026 against 5,291 live US listings pulled twice, 52 minutes apart,
What moved in 52 minutes
| Measure | Value |
|---|---|
| Listings present in both pulls | 4,137 |
| Priced in both | 4,093 |
| Asking price changed | 42 (1.03%) |
| Moved up / moved down | 23 / 19 |
| Median size of a move | 5.3% |
| Largest move | 104.3% |
| Availability value changed | 0 |
One per cent in under an hour is higher than it sounds — it is not a stable catalogue — and it is far lower than the impression you get from writing about affiliate content, where price volatility is treated as the central hazard. Over a week that rate would move a substantial minority of a catalogue. Over the hour after you publish, it moves almost nothing.
The moves themselves are ordinary. A Wayfair North America electric kettle went from $38.99 to $32.99. A Poshmark wool scarf went from $22.00 to $19.00 and a different one from $30.00 to $57.00 — a seller repricing their own item, which is a thing that only happens on resale. The largest moves in the sample were textbook rentals, where the number is a rental term rather than a product price and doubles between terms.
Note the last row of that table. Not one of the 4,137 matched listings changed its availability value in 52 minutes. Stock status, as published in a feed, is not a live signal at this timescale.
The bigger number, and its honest caveat
1,154 of the 5,291 listings in the first pull were absent from the second: 21.8%. In the other direction, 1,155 listings appeared in the second pull that had not been in the first. The catalogue did not shrink; it reshuffled.
The caveat matters and we are putting it before the conclusion. That 21.8% is an upper bound on real churn, not a measurement of it. Two identical queries against this API do not necessarily return the same rows, particularly at depth — we and other runs have seen the same query serve different result sets with nothing changed. So some unknown share of those 1,154 listings still exist and simply were not in the second answer. We cannot separate the two with this design, and we are not going to pretend the number is cleaner than it is.
What survives the caveat is the comparison. Whatever the true churn rate, the chance that a given listing is not where you left it is an order of magnitude larger than the chance its price has moved. That is the finding, and it points writing advice in a different direction from the usual one.
Keep reading
It is very uneven by category
The aggregate hides the useful part. “Moved” is listings that changed price; “gone” is listings from the first pull that were not in the second.
| Search | Matched in both | Price moved | Gone | Gone share |
|---|---|---|---|---|
| vinyl record | 195 | 15 | 19 | 9% |
| board game | 197 | 8 | 42 | 18% |
| air fryer | 265 | 4 | 21 | 7% |
| electric kettle | 240 | 4 | 9 | 4% |
| hiking boots | 236 | 3 | 82 | 26% |
| wool scarf | 239 | 2 | 61 | 20% |
| cordless drill | 312 | 2 | 23 | 7% |
| yoga mat | 278 | 2 | 23 | 8% |
| bluetooth speaker | 234 | 2 | 59 | 20% |
| vhs tape | 273 | 0 | 12 | 4% |
| vintage denim jacket | 212 | 0 | 81 | 28% |
| leather handbag | 236 | 0 | 91 | 28% |
| running shoes | 174 | 0 | 40 | 19% |
| gold necklace | 234 | 0 | 97 | 29% |
| trucker hat | 211 | 0 | 128 | 38% |
| mini skirt | 185 | 0 | 149 | 45% |
| platform sandals | 227 | 0 | 56 | 20% |
| sunglasses | 189 | 0 | 161 | 46% |
Two patterns, and they run opposite ways.
Price movement is a conventional-retail phenomenon. Vinyl records (15 moves), board games (8), air fryers and electric kettles (4 each) account for most of it. Eight of the 18 searches recorded zero price changes, and they are the marketplace-dominated ones: denim jackets, handbags, running shoes, necklaces, trucker hats, mini skirts, platform sandals, sunglasses. A private seller does not run a pricing algorithm.
Disappearance is the reverse. Sunglasses lost 46% of their rows between pulls, mini skirts 45%, trucker hats 38% — all resale-heavy. VHS tapes lost 4% and electric kettles 4%. So the two hazards sit in different categories: if you write about new goods from shops your risk is the number going stale, and if you write about secondhand your risk is the item not being there at all. Almost nobody writes as though those are different problems.
So how do you write the line?
Four rules, in the order they earn their keep against the numbers above.
1. Write for the item vanishing, not for the price moving
This is the whole point. If the sentence only works while one particular listing exists, it is fragile in the way that actually happens. Name the thing well enough that a reader could find another one: the brand, the model, the material, the size, the era. A person who can search for it is not blocked by a dead link.
2. Use bands, not numbers, in the sentence
“Around $30”, “usually under $50”, “$20–$40 depending on the retailer”. A band absorbs a 5% median move without becoming false. A specific figure is either right or wrong, and it starts being wrong on a schedule you do not control.
3. Put the exact price where it can be dated and updated
Not in the prose. In a table, a caption, or a line that says when it was checked. Then the exact number is a dated observation rather than a claim, it can be corrected in one place, and the sentence around it never has to change. This page carries its own dated line for the same reason.
4. Say what the price is doing, if you know
“This has been sitting at about $30 all month” is more useful than $29.99, and it stays true. “This is on sale; it is usually nearer $50” is the most useful sentence in a product recommendation and almost nobody writes it, because it takes two observations instead of one.
Four rewrites
| Fragile | Durable | Why |
|---|---|---|
| “This kettle is $38.99.” | “This kettle sits in the high $30s; it was $38.99 when we checked on 8 September.” | Survives the $6 drop we measured on that exact listing. |
| “Get this exact jacket, link below.” | “Look for a mid-90s heavyweight denim jacket in this cut — here is one at $38.” | Resale rows were the likeliest to disappear between pulls. |
| “Best price anywhere.” | “Cheapest of the four retailers we checked on 8 September.” | A superlative has no expiry date and is therefore always about to be wrong. |
| “On sale now!” | “Currently marked down from $50; it has been on offer since we first saw it.” | Dates the claim and tells the reader something the retailer does not. |
Frequently asked
How often do affiliate product prices actually change?
In two identical pulls 52 minutes apart on 8 September 2026, 42 of 4,093 listings priced in both had changed asking price: 1.03%, split 23 up and 19 down, with a median move of 5.3%.
What is more likely, a price change or a listing disappearing?
Disappearing, by roughly twenty to one over the same interval. 21.8% of listings in the first pull were absent from the second, against 1.03% that changed price. Some of that 21.8% is result-set instability rather than real churn, so treat it as an upper bound.
Which product categories have the most stable prices?
Resale ones. Eight of 18 searches recorded zero price changes over 52 minutes and all eight were dominated by a peer-to-peer marketplace. Price movement concentrated in conventional retail: vinyl records, board games, air fryers and electric kettles.
Should you put prices in a caption at all?
Put a band in the sentence and the exact figure somewhere it can be dated and corrected. A band absorbs the typical move; a specific number is right or wrong and starts being wrong on someone else's schedule.
Does stock status change quickly?
Not at this timescale. Not one of 4,137 listings matched across both pulls changed its published availability value in 52 minutes.
Method, scope and seed list
Two pulls, 52 minutes apart, on 18 of this run’s 24 keyword seeds: vintage denim jacket, leather handbag, running shoes, hiking boots, wool scarf, gold necklace, vinyl record, vhs tape, trucker hat, mini skirt, platform sandals, sunglasses, air fryer, electric kettle, cordless drill, yoga mat, bluetooth speaker, board game. Four pages of 100 rows per seed each time, US-filtered on every row’s own country field, matched across the pulls on retailer plus title plus destination URL. Asking price is the sale price where a row carries one and the list price otherwise.
What this cannot show. Fifty-two minutes is one interval on one evening, and a rate measured over an hour does not extrapolate cleanly to a week. The disappearance figure mixes real churn with the API returning a different result set for an identical query, and this design cannot separate them. We did not observe any actual sale, so nothing here says what a shopper paid.
How this page was made. Drafted with AI (Claude); not yet independently re-checked. How we work